
Fortigate flow troubleshooting tools
In this article I will go through the two Fortigate command line utils that are used for flow troubleshooting. There are different capture mechanisms as well as debugging outputs that can be useful to understand the packet walk and the inner working of the Fortigate unit. In the present case I will focus on flow verification and troubleshooting which is one of the most useful knowledge.
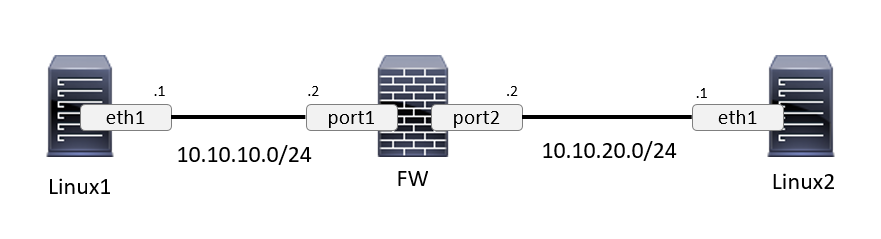
Consider the following simple topology where host Linux1 wants to communicate with host Linux2.
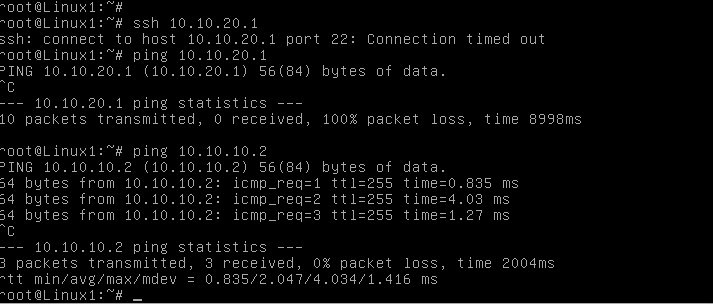
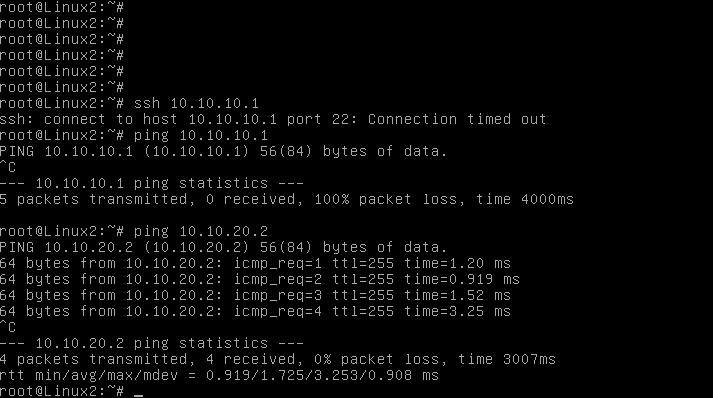
Currently the hosts are unable to communicate with SSH and cannot simply ping each other.
The first check is to verify the next-hop reachability. In the present case it is OK, each Linux workstations can ping the firewall interface.
Something clearly happens on the firewall side. Let’s find this out.
The first tool I will use is a simple trace command:
(note that you can adjust the verbosity level and the displayed information with the numbers at the end of the command)
FW # diagnose sniffer packet port1
filter   Flexible logical filters for sniffer (or "none").
For example:  To print UDP 1812 traffic between forti1 and either forti2 or forti3
'udp and port 1812 and host forti1 and ( forti2 or forti3 )'

FW # diagnose sniffer packet port1 'dst 10.10.20.1'
verbose
1: print header of packets
2: print header and data from ip of packets
3: print header and data from ethernet of packets (if available)
4: print header of packets with interface name
5: print header and data from ip of packets with interface name
6: print header and data from ethernet of packets (if available) with intf name

FW # diagnose sniffer packet port1 'dst 10.10.20.1' 1 4
Then I retried a SSH connection from 10.10.10.1 to 10.10.20.1.
FW # diagnose sniffer packet port1 'dst 10.10.20.1' 1 4
interfaces=[port1]
filters=[dst 10.10.20.1]
10.880000 10.10.10.1.60368 -> 10.10.20.1.22: syn 2179876642
13.880000 10.10.10.1.60368 -> 10.10.20.1.22: syn 2179876642
19.880000 10.10.10.1.60368 -> 10.10.20.1.22: syn 2179876642

3 packets received by filter
0 packets dropped by kernel

FW #
3 SYN packets sent but no response, this might be blocked… Well, in order to get the full packet walk details, let’s use the filter feature.
The process of filter configuration is a bit different and requires a few extra commands:
FW # diagnose debug enable
FW # diag debug flow filter addr 10.10.10.1 10.10.20.2
FW # diag debug flow show console enable
FW # diag debug flow trace start 1000
Tip: The number in the “diag debug flow trace start” command is the number of captured lines that will be displayed by the system. In dense environments, I advise you limit this number to avoid capturing too much traffic.
Then I retried SSH again and now we are able to see the reason why the packet is dropped, which is because of a “policy check” (a rule). The VDOM and the ID of the policy are also displayed so you can find it easily. If the packet goes through the firewall multiple times because of VDOMs, you will be able to track it with this powerful command. In our case, the SSH is caught by the default deny rule at the bottom of the ruleset (policy 0).
id=20085 trace_id=1 func=print_pkt_detail line=4378 msg="vd-root received a packet(proto=6, 10.10.10.1:60369->10.10.20.1:22) from port1. flag [S], seq 3960058270, ack 0, win 3840"
id=20085 trace_id=1 func=init_ip_session_common line=4527 msg="allocate a new session-0000003c"
id=20085 trace_id=1 func=vf_ip4_route_input line=1596 msg="find a route: flags=00000000 gw-10.10.20.1 via port2"
id=20085 trace_id=1 func=fw_forward_handler line=545 msg="Denied by forward policy check (policy 0)"
id=20085 trace_id=2 func=print_pkt_detail line=4378 msg="vd-root received a packet(proto=6, 10.10.10.1:60369->10.10.20.1:22) from port1. flag [S], seq 3960058270, ack 0, win 3840"
id=20085 trace_id=2 func=init_ip_session_common line=4527 msg="allocate a new session-0000003d"
id=20085 trace_id=2 func=vf_ip4_route_input line=1596 msg="find a route: flags=00000000 gw-10.10.20.1 via port2"
id=20085 trace_id=2 func=fw_forward_handler line=545 msg="Denied by forward policy check (policy 0)"
++snipped++
Once the trace completed, you will have to stop the debug and clear the capture filters so the next operator will start with a clean slate.
FW # diag debug flow trace stop
FW # diagnose debug flow filter clear

optionnal : FW # diagnose debug reset
Once the diagnosis made, let’s add a policy to allow SSH to go through the firewall and check again.
Tips: edit policy ID 0 will automatically choose the next ID available.
FW # config firewall address
FW (address) # edit Linux1
new entry 'Linux1' added
FW (Linux1) # set type ipmask
FW (Linux1) # set subnet 10.10.10.1/32
FW (Linux1) # next
FW (address) # edit Linux2
new entry 'Linux2' added
FW (Linux2) # set type ipmask
FW (Linux2) # set subnet 10.10.20.1/32
FW (Linux2) # end

FW # config firewall service custom
FW (custom) # edit SSH
FW (SSH) # set protocol TCP
FW (SSH) # set tcp-portrange 22 22
FW (SSH) # end

FW # config firewall policy
FW (policy) # edit 0
new entry '0' added
FW (0) # set srcintf port1
FW (0) # set srcaddr Linux1
FW (0) # set dstaddr Linux2
FW (0) # set service SSH
FW (0) # set dstintf port2
FW (0) # set status enable
FW (0) # set schedule always
FW (0) # set action accept
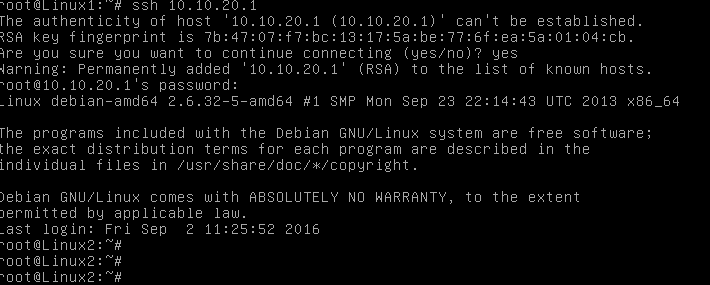
Then I retried again and this time the SSH worked.
If we look at the filter debug output, we can see the full packet path
The packet comes to the Fortigate unit and a new session is allocated. The packet is examined against the defined policies and is accepted because it matches the policy 1. The routing is also checked and a route is found leaving the unit on port 2.
id=20085 trace_id=7 func=print_pkt_detail line=4378 msg="vd-root received a packet(proto=6, 10.10.10.1:60373->10.10.20.1:22) from port1. flag [S], seq 2673690169, ack 0, win 3840"
id=20085 trace_id=7 func=init_ip_session_common line=4527 msg="allocate a new session-00000048"
id=20085 trace_id=7 func=vf_ip4_route_input line=1596 msg="find a route: flags=00000000 gw-10.10.20.1 via port2"
id=20085 trace_id=7 func=fw_forward_handler line=670 msg="Allowed by Policy-1:"
Then the reply packet sent from Linux2 is received by the firewall on port2. An existing session for this flow is found and the packet is allowed and a route is found.
id=20085 trace_id=8 func=print_pkt_detail line=4378 msg="vd-root received a packet(proto=6, 10.10.20.1:22->10.10.10.1:60373) from port2. flag [S.], seq 820312813, ack 2673690170, win 3792"
id=20085 trace_id=8 func=resolve_ip_tuple_fast line=4437 msg="Find an existing session, id-00000048, reply direction"
id=20085 trace_id=8 func=vf_ip4_route_input line=1596 msg="find a route: flags=00000000 gw-10.10.10.1 via port1"
Lastly, a new packet belonging to the same session is received from Linux1. Because it belongs to an existing session, it is not checked again and is directly forwarded (fastpath). This kind of mechanisms can speed up the packet processing (a similar acceleration method from Checkpoint is SecureXL).
id=20085 trace_id=9 func=print_pkt_detail line=4378 msg="vd-root received a packet(proto=6, 10.10.10.1:60373->10.10.20.1:22) from port1. flag [.], seq 2673690170, ack 820312814, win 30"
id=20085 trace_id=9 func=resolve_ip_tuple_fast line=4437 msg="Find an existing session, id-00000048, original direction"
id=20085 trace_id=9 func=ipv4_fast_cb line=50 msg="enter fast path"
I hope this has been informative for you.
Links:
http://kb.fortinet.com/kb/viewContent.do?externalId=11186
http://kb.fortinet.com/kb/viewContent.do?externalId=FD30038